BrokerTec
Cboe Futures Exchange (CFE)
Cboe U.S. Equity Options
Chicago Board of Trade (CBOT)
COMEX
Fenics
ICE Futures U.S.
Minneapolis Grain Exchange (MGEX)
Montréal Exchange (MX)
New York Mercantile Exchange (NYMEX)
Nodal Exchange
1In development.
2Access provided via FIX bridge through CN First International Futures Limited.
3Access provided via FIX bridge through local brokers, including Samsung Futures.
As we release X_TRADER® 7.17, TT is opening new paths and exploring new futures trading software technology.
I recently visited Vail, Colorado to explore new paths of a different nature. Why head to the mountains in the middle of the summer? There’s no better hiking to be found, and certainly no better way to know and understand the foundation of future adventures there. Hiking a mountain while it is cleared of snow gives the advantage of understanding your base and sensing your support. It’s a slower trip down the mountain, but your route is clear and you are more assured of reaching your goal successfully and leveraging what you learned along the way.
Understanding the core needs of your current and potential customer base is critical for the success of any product. Topical knowledge of your field is beneficial, but root-level understanding of your domain is critical.
X_TRADER 7.17 brings out many solutions that the futures industry has required and, in some instances, lacked. We have trumpeted the new TT DMA MutliBroker ASP solution for months now, and uptake in the field during our beta release was highly encouraging. We have opened doors and gained traction in segments of our industry that previously maintained barriers—artificial in some instances—that kept our software outside of their reach.
X_TRADER 7.17 contains much more than a solution for routing orders to multiple brokers. We’ve addressed complex order-desk management issues that I know from my own CTA and sell-side order desk experience, and countless customer interviews will take a big bite out of the annoying statement that always starts with “My job would be a lot easier if I could…”
Continue Reading →
With the release of X_STUDY® 7.8.0, users of our charting application can now apply a technical indicator (or study) to the value of another technical indicator. Although this feature can be used in many ways, two primary ways are to help measure market conditions and increase or improve trading signals. I’ll show a few simple examples of this feature, which we call study on study.
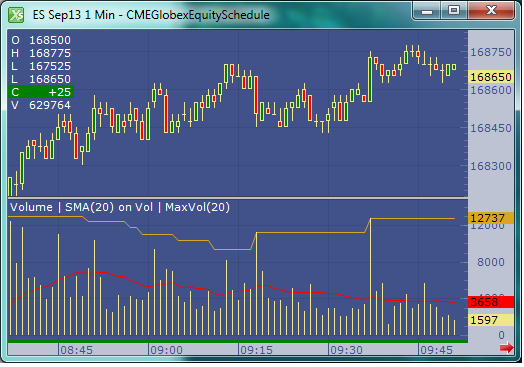
A classic study on study is to place a moving average on the volume indicator. Averaging the last few volume bars helps to gauge what kind of tempo the market is experiencing relative to the past. In addition, volume levels are compared to averages, especially at highs and lows.
 |
| Figure 1: One-minute September E-mini S&P 500 chart |
Figure 1 above shows a chart with a red moving average placed on the volume indicator. Notice I also added a second study on study with an orange max indicator applied to volume. This max study simply finds the maximum value over the user-defined look-back period. Both the simple moving average and the maximum indicators are looking back 20 bars.