 |
| Figure 1: TT Analytics in ADL. |
With the release of X_TRADER® 7.17.40, TT introduced a new feature in ADL® named TT Analytics. This feature uses a single block that brings a historical data solution to ADL along with a suite of technical indicators. It provides almost every value found in an X_STUDY® chart to your server-side algo. In this blog post, I will introduce the block while demonstrating how to find some important trading reference points.
The TT Analytics Block can be found under Misc. Blocks on the left side of the ADL Designer Window. You simply drag this block onto the canvas and double click it to expose the properties page. If you’re an X_STUDY user, the properties page will look familiar to you. Here you can add technical indicators and expose bar values such as open, high, low and close.
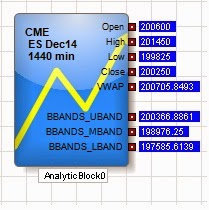
Figure 1 above shows the block with open, high, low, close and VWAP for the current daily bar of the December ES market. It also shows the Bollinger Bands technical indicator added to the block.
Next, you add an Instrument block to the TT Analytics Block from within the properties page and define the type of bar data you want returned. Once this is complete, you can go in either of two different directions: you can add a technical indicator to the block or expose more bar data.
Continue Reading →
Tags: Algos & Spread Trading, Charting, Trade Execution