X_STUDY charts offer more than traditional bar data. Along with the open, high, low, close and volume for each bar, X_STUDY provides additional data points, like the total number of market sellers hitting the bid, or bid volume, and the total number of market buyers lifting the offer, or ask volume. As explained in my last blog, these bars can be time-based or volume-based.
Today I’d like to talk about TT CVD, a true leading technical indicator that works off these powerful market data points.
You might be thinking: “All technical indicators are lagging indicators.” But after you see how TT CVD is calculated, you will probably agree that this is a leading indicator. It can complement just about any trading strategy, too.
TT CVD Overview
TT CVD uses the bid and ask volume data to display the running difference of the ask volume (the market buying pressure) minus the bid volume (the market selling pressure)—or, in short, the cumulative volume delta (CVD). Let’s walk through a real-world example to illustrate how TT CVD is calculated.
Figure 1 below shows a chart of the December E-mini S&P 500 contract with three studies. The first, Volume Delta—Histogram, displays the total bid and ask volumes. The second, Volume Delta, displays the difference of the ask volume minus the bid volume. These two studies will help me explain the third study, TT CVD.
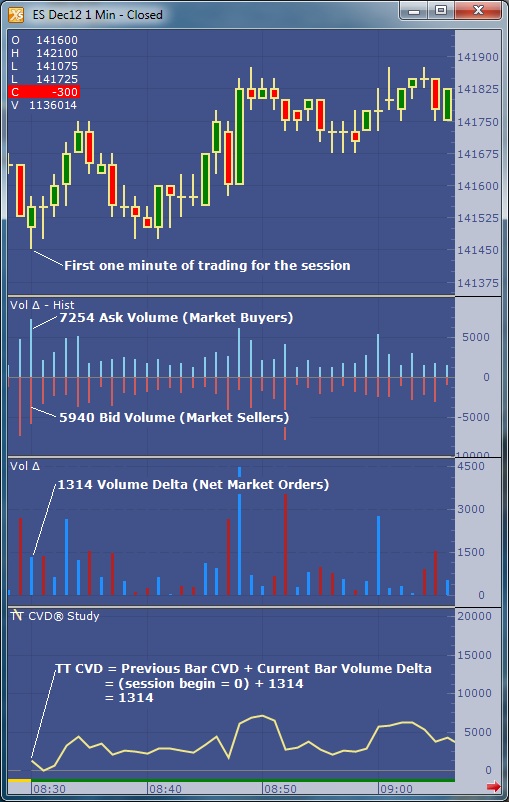 |
| Figure 1: One-Minute December E-mini S&P 500 Chart |
In the opening one-minute period, 7,254 contracts are bought on the ask and 5,940 contracts are sold on the bid. There is a net market volume change, or volume delta, of +1,314 (7,254 minus 5,940). Since this is the beginning of the session and TT CVD is configured to reset at the beginning of a session, its value is simply the volume delta for this opening bar of +1,314.
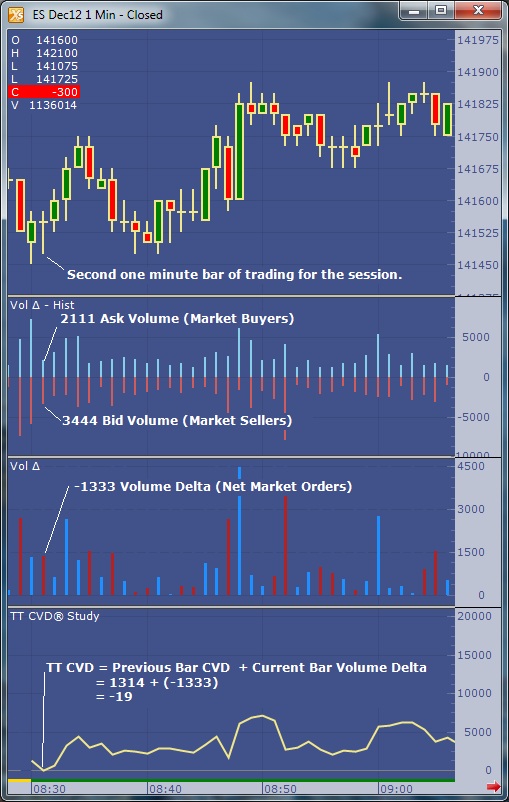
Moving on to the next minute, in Figure 2 below, we see 2,111 contracts are bought on the ask and 3,444 contracts are sold on the bid. The volume delta is going to be negative here, since there were more market sellers than market buyers. The volume delta equals -1,333 for the second one-minute period of the day (2,111 minus 3,444).
 |
| Figure 2: One-Minute December E-mini S&P 500 Chart |
TT CVD for the second bar is equal to the previous bar’s TT CVD value plus the volume delta. Continuing with our example, the previous bar’s TT CVD is +1,314, and the second bar’s volume delta is -1,333. Therefore, TT CVD equals -19 (1,314 minus 1,333). TT CVD continues to cumulate the volume delta for the remainder of the session and is a clear measurement for market order flow.
TT CVD and Daily Net Change
Now that we’ve explained how TT CVD is calculated, let’s compare the same setup for this study to the daily net change. TT CVD values trend similarly to the actual price data, since net market buying and selling should have a direct and correlated impact on the price. The larger the magnitude of TT CVD value, the greater the net change should be for the day.
Figure 3 below shows several days, with each day outlined and a net change value labeled. I used last traded price for each day, not the settle. For most days, if TT CVD is positive, so is the net change for the day. Likewise, if TT CVD is negative, so is the net change for the day. Sampling the last 90 trading days for this contract will show this statement is true for 67 days, or 74 percent of the time.
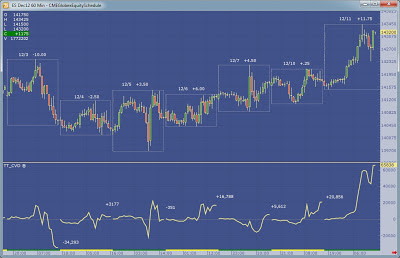 |
| Figure 3: 60-Minute December E-mini S&P 500 Chart |
The remaining 23 days sampled will be similar to December 4 and 5 in Figure 3. These days are generally neutral days with sideways action. The net change and TT CVD values are both near unchanged.This is one of the main reasons why the two values sometimes don’t line up with one another.
Now that you’ve seen how TT CVD works off more powerful market data points than just the open, high, low and close, I hope you agree that it is a true leading technical indicator. If you aren’t already using TT CVD, take the next step and add TT CVD to your X_STUDY charts so you can observe this leading technical indicator work in real time. And if you aren’t already using X_STUDY, what are you waiting for? It’s included free with all X_TRADER licenses. Learn more about X_STUDY here.
My next blog will look at another influential market data point that’s included in X_STUDY. Until then, plan the trade and trade the plan.
Tags: Charting
Note: If you’re not familiar with X_STUDY®, I encourage you to review the X_STUDY materials on our website. You’ll gain a solid understanding of this trader-centric charting application, which is fully integrated with TT’s X_TRADER® platform and provided to all X_TRADER users at no additional cost.
As the product manager for X_STUDY, TT’s charting and analytics application, I’d like to talk about constant volume bars. Constant volume bars build bars based on fixed volume instead of fixed time. There are several advantages to constant volume bars when compared to time-based bars.
Shorter time-based bars, like one-minute and five-minute bars, are great during the day when there are many market participants and the market tempo is fast. When market tempo slows and price action begins to consolidate, shorter time-based bars will continue generating bars as time passes. Too many of these time-based bars will inevitably flatten out your analytics, which can then generate whipsawed losing trades or take you out of a good trade.
A Case for Constant Volume Bars
A constant volume bar conforms to the market’s tempo. As the market tempo slows, so will the formation of new bars. As the tempo increases, so will the number of bars created. Volume bars are ideal for when events happen in the marketplace, too. For example, the release of an economic event at 1:15 can leave your five-minute bar waiting until 1:20, while the volume bars have already created four new bars in that five-minute window. These four faster-responding volume bars give your strategy more opportunity to react to the event that has just occurred in the market.
Likewise, who needs 12 five-minute bars from 12:15 to 1:15 before that economic number comes out when volume is light? Your analytics will be flat with time-based bars and won’t be able to help you make decisions. A volume chart in this same period might only form one bar. The concept of constant volume bars creates an intelligent bar that reacts to the market’s trading volume.
An Example
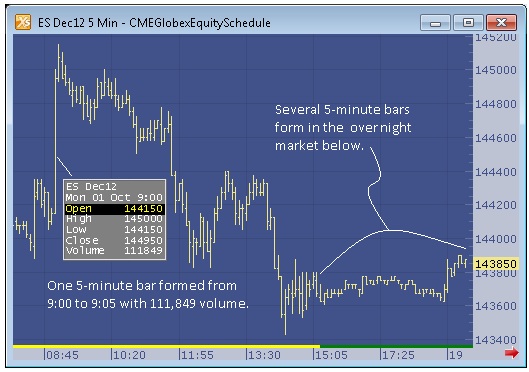
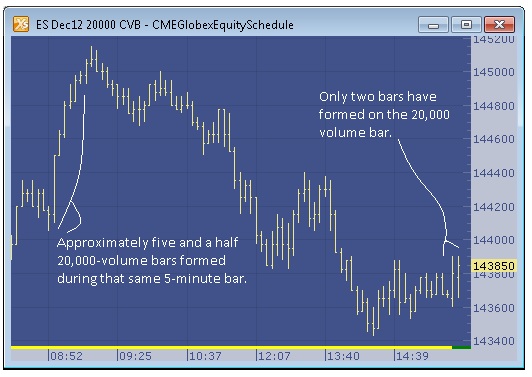
Let’s look at the scenario below, which uses the ES Dec12 contract from earlier this month. Compare a five-minute chart to a 20,000-volume chart. It will show advantages for when markets have both a fast and slow tempo. The five-minute bar chart shows a one-bar spike in the morning hours. The 9:00 to 9:05 a.m. bar in ES spikes to 1450.00. Comparing this bar to the 20,000-volume chart, we can see that approximately 5½ bars were formed on the constant volume bar chart during the same time.
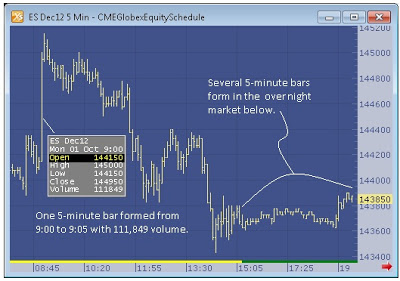
Now look at the overnight market above. Here we can see more than forty bars have formed on the five-minute bar chart. This many bars will cause most technical indicators to flatten out and any automated system to start generating false signals, especially if the technical indicators are using fast values like a simple moving average of six bars. (I actually do not display all the bars here; there are more off to the right of the chart. You can tell this by the little red arrow at the bottom of the five-minute chart.)
The 20,000-volume bar has only produced two bars, with the second one still incomplete. At the time of the screenshot, the bar was only half complete, with around 11,000 volume. This example illustrates the improvement constant volume bars provide in both fast- and slow-moving markets.
In Closing
In my experience, I’ve found that constant volume bars can really improve analytics and help eliminate some of the whipsaws.This isn’t to say time-based charts are unnecessary. In fact, I myself still use time-based charts in much of my analysis. I don’t think I could give up daily charts; they are just too ingrained in my analysis. Rather, I’m simply suggesting that you might gain a little edge by looking at a combination of volume-based and time-based charts.Until next time, plan the trade and trade the plan.
Tags: Charting