A Leading Technical Indicator for Charting in X_STUDY®: TT CVD®
X_STUDY charts offer more than traditional bar data. Along with the open, high, low, close and volume for each bar, X_STUDY provides additional data points, like the total number of market sellers hitting the bid, or bid volume, and the total number of market buyers lifting the offer, or ask volume. As explained in my last blog, these bars can be time-based or volume-based.
Today I’d like to talk about TT CVD, a true leading technical indicator that works off these powerful market data points.
You might be thinking: “All technical indicators are lagging indicators.” But after you see how TT CVD is calculated, you will probably agree that this is a leading indicator. It can complement just about any trading strategy, too.
TT CVD Overview
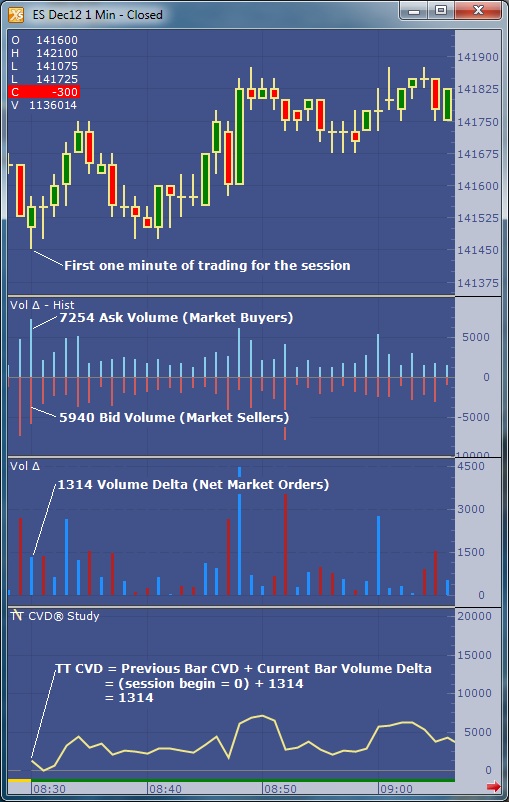
Figure 1 below shows a chart of the December E-mini S&P 500 contract with three studies. The first, Volume Delta—Histogram, displays the total bid and ask volumes. The second, Volume Delta, displays the difference of the ask volume minus the bid volume. These two studies will help me explain the third study, TT CVD.
|
| Figure 1: One-Minute December E-mini S&P 500 Chart |
In the opening one-minute period, 7,254 contracts are bought on the ask and 5,940 contracts are sold on the bid. There is a net market volume change, or volume delta, of +1,314 (7,254 minus 5,940). Since this is the beginning of the session and TT CVD is configured to reset at the beginning of a session, its value is simply the volume delta for this opening bar of +1,314.
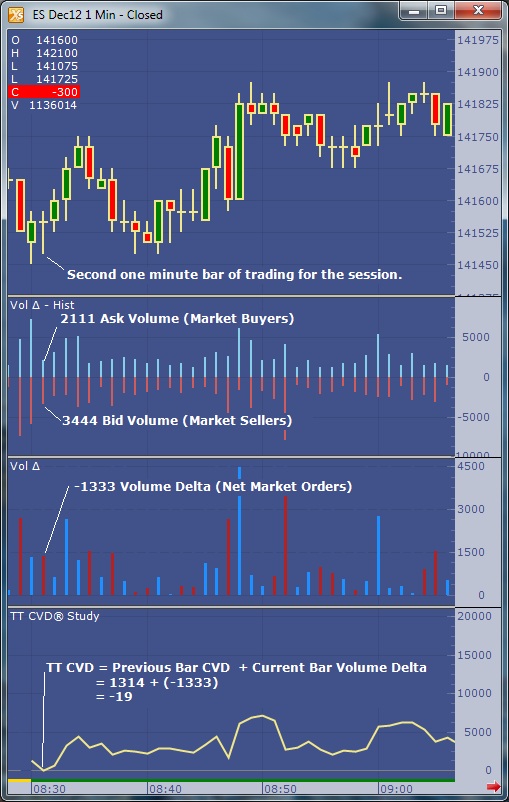 |
| Figure 2: One-Minute December E-mini S&P 500 Chart |
TT CVD for the second bar is equal to the previous bar’s TT CVD value plus the volume delta. Continuing with our example, the previous bar’s TT CVD is +1,314, and the second bar’s volume delta is -1,333. Therefore, TT CVD equals -19 (1,314 minus 1,333). TT CVD continues to cumulate the volume delta for the remainder of the session and is a clear measurement for market order flow.
TT CVD and Daily Net Change
Now that we’ve explained how TT CVD is calculated, let’s compare the same setup for this study to the daily net change. TT CVD values trend similarly to the actual price data, since net market buying and selling should have a direct and correlated impact on the price. The larger the magnitude of TT CVD value, the greater the net change should be for the day.
Figure 3 below shows several days, with each day outlined and a net change value labeled. I used last traded price for each day, not the settle. For most days, if TT CVD is positive, so is the net change for the day. Likewise, if TT CVD is negative, so is the net change for the day. Sampling the last 90 trading days for this contract will show this statement is true for 67 days, or 74 percent of the time.
 |
| Figure 3: 60-Minute December E-mini S&P 500 Chart |
The remaining 23 days sampled will be similar to December 4 and 5 in Figure 3. These days are generally neutral days with sideways action. The net change and TT CVD values are both near unchanged.This is one of the main reasons why the two values sometimes don’t line up with one another.
Now that you’ve seen how TT CVD works off more powerful market data points than just the open, high, low and close, I hope you agree that it is a true leading technical indicator. If you aren’t already using TT CVD, take the next step and add TT CVD to your X_STUDY charts so you can observe this leading technical indicator work in real time. And if you aren’t already using X_STUDY, what are you waiting for? It’s included free with all X_TRADER licenses. Learn more about X_STUDY here.
My next blog will look at another influential market data point that’s included in X_STUDY. Until then, plan the trade and trade the plan.