Thursday 12 September 2024
Andaz London Liverpool Street
TT® Score: Trade Surveillance with Machine Learning
The Need for Trade Surveillance
The financial industry has experienced great change and extraordinary challenges in the wake of the 2008 global financial crisis. The last several years in particular have seen unprecedented regulatory reforms across all aspects of the banking and trading industries, both within the United States and worldwide.
One of the biggest challenges that both regulators and compliance staff face is consistently ensuring that the market participants they supervise stay fully compliant with current market regulations. Regulators want to ensure that markets are fair and efficient, and compliance staff understand that the risks of failing to detect disruptive or manipulative trading behavior can be extremely costly.
As a result, rapid and accurate detection of prohibited market practices has become of paramount importance to all business in the financial industry.
Traditional Parameter-Based Surveillance Tools
Traditional surveillance tools, often developed in house or available through various third-party vendors, are almost exclusively parameter- or rule-based. They function by applying if-then logic overlaid with configurable thresholds over arbitrary windows of time. In theory, the ability to configure these parameters lets users customize the alert output to their business needs; however, in practice, such configurations are often set to fit the capacity of the department reviewing the alerts, not on the validity of the results. This poses serious risk for compliance staff because the reasoning behind each threshold must stand up to regulatory scrutiny and be defensible in light of the firm’s business model and customer base. If the parameters are too tight, there is a risk of missing abusive conduct, and if they are too loose, then the reports are inundated with false positives.
Complicating this parameter-setting further, most every entity that requires surveillance, be it a small prop shop or an exchange, has a variety of trading strategies functioning at any given moment. One strategy might trade 1,000 contracts at a time, while another might never enter an order larger than a single contract. No matter where an account falls in the spectrum of trading volume or style, they all need to be surveilled for the same potential abusive behavior. This is where parameter-based surveillance tools can fall down. When a surveillance tool is comprised of a series of inflexible thresholds for things like volume totals, order size or cancellation rates, its effectiveness often will be limited to a very specific type of activity in products with a specific liquidity profile, leading to false negatives in products outside a specific profile.
The inflexible thresholds in traditional surveillance tools cause false negatives in other ways as well. For example, very few spoofing schemes are perfect. Most schemes are riddled with noise, unintended or opportunistic fills, late cancels, varying order sizes and general randomness outside of the trader’s control. Invariably, spoofing activity that would appear obvious even to an untrained eye will not be flagged due to some element of the activity not meeting an arbitrary threshold, such as the spoof order was only partially cancelled, or fills occurred on both sides of the market even if one side received the bulk of the beneficial executions. Any small deviation from the pre-set spoofing thresholds can break the continuous chain of precise events required to generate a parameter-based alert.
A Machine Learning Approach to Trade Surveillance
Machine learning is a field of artificial intelligence (AI) that involves the training of algorithms that don’t follow strict “if-then” logic or decision trees. Rather, the machine learning algorithms make use of “features.” These features allow for the algorithm to automatically aggregate clusters of activity based upon behavioral intent and score them based upon their similarity to trading patterns from known regulatory cases. See Figure A.
The features are applied such that every trade and transaction is surveilled, not just the worst offenders. In addition, regulators and compliance staff no longer have the burden of configuring parameter thresholds upon initial installation or the ongoing maintenance of those thresholds.
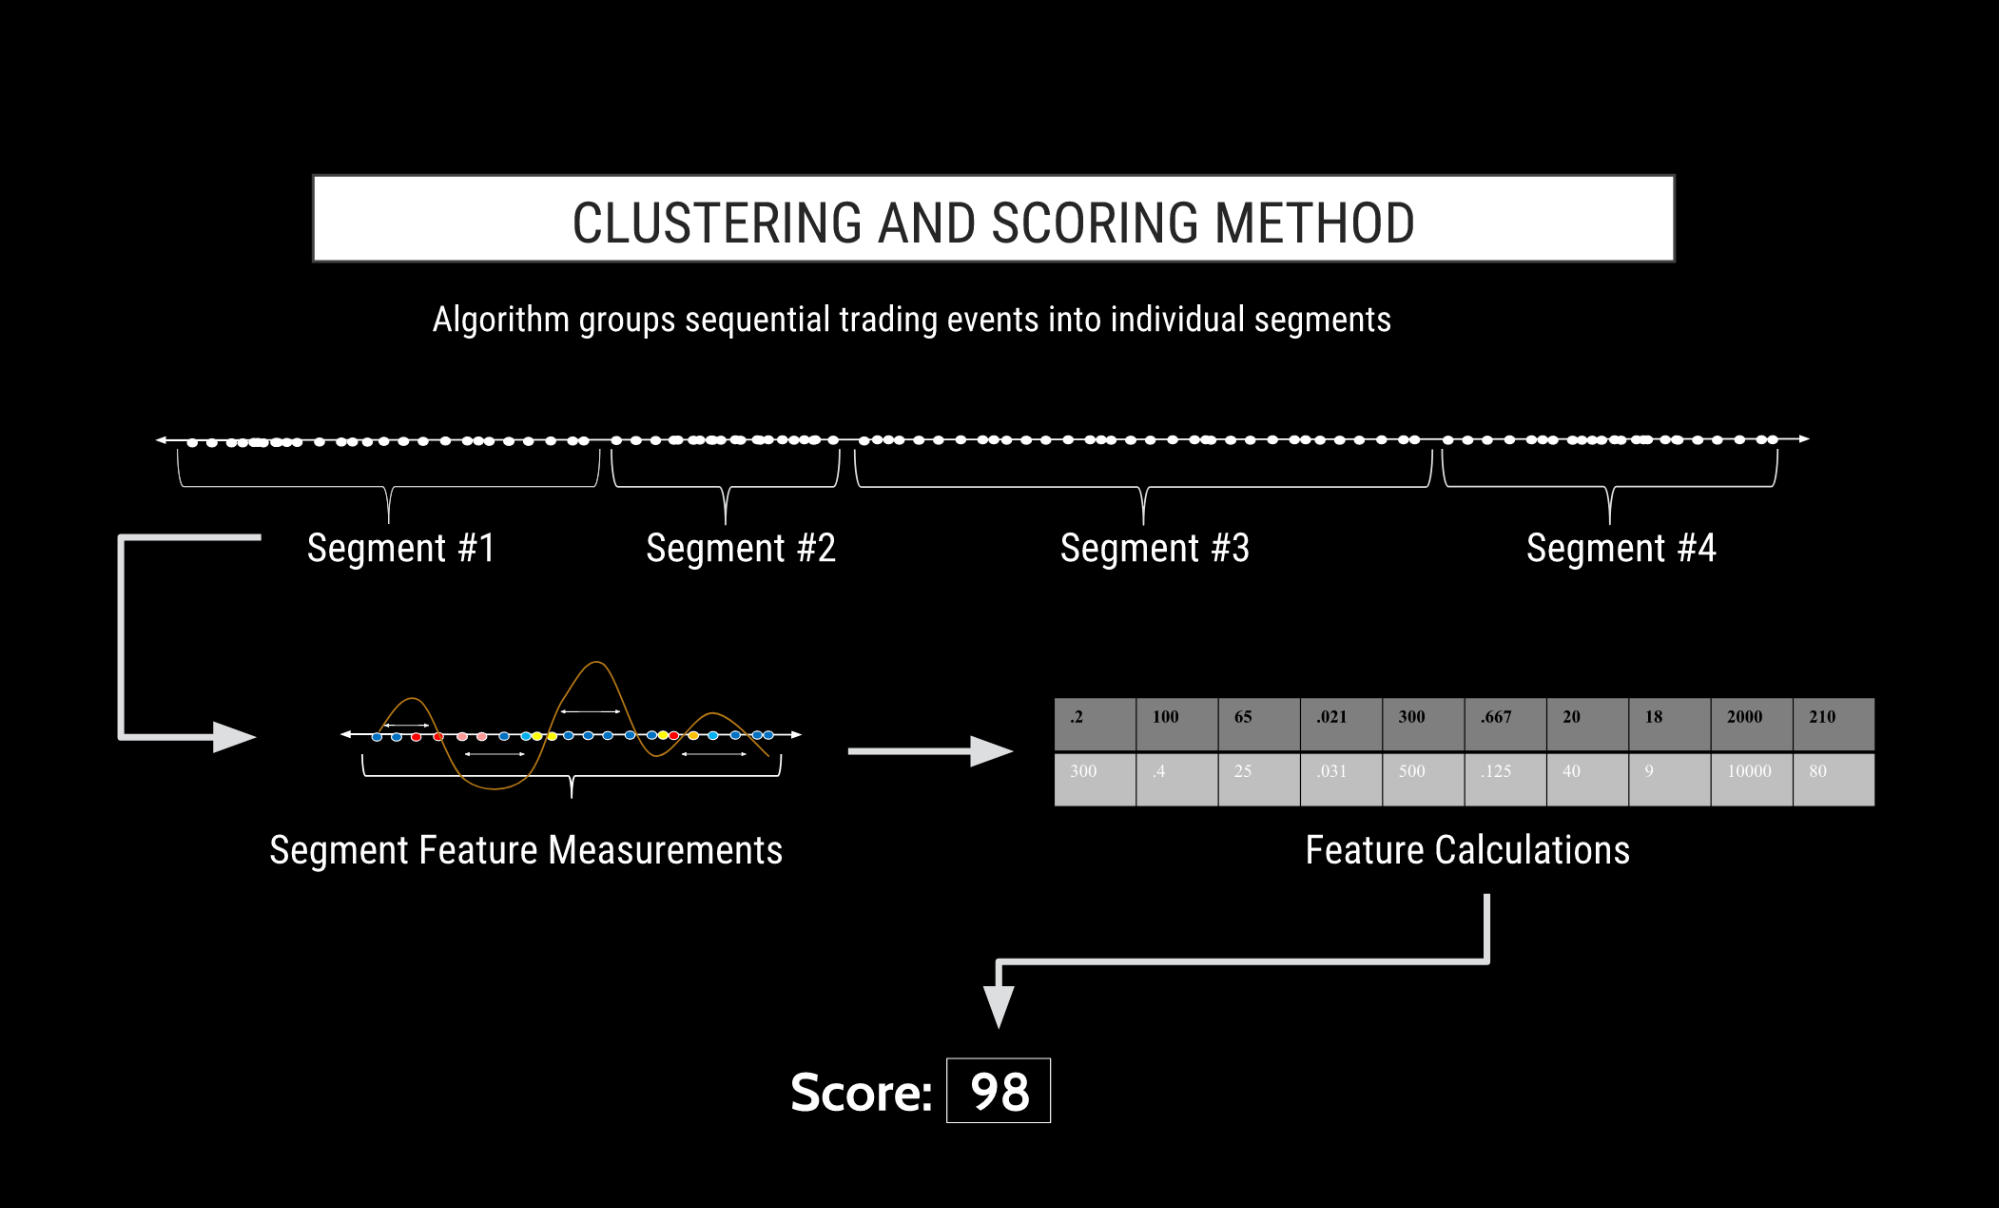
Figure A
Application of Machine Learning Data
We have collected training data from numerous sources (most notably from regulatory cases) that is used to train the neural cortexes (the “models”) of our machine learning detection system. The training data provides the seed patterns that each model utilizes to identify similar disruptive or manipulative trading behavior.
When regulatory data is unavailable for a particular type of manipulative or disruptive trading activity, we train the models utilizing customized training data developed by several domain experts with backgrounds in both the business and regulatory sides of the financial industry.
Clustering Algorithm
TT Score’s advanced clustering algorithm segments a trader’s activity into “clusters” based upon factors such as time, trader, financial instrument and proximity of other order actions. Each cluster is essentially a slice of time of a trader’s audit trail where the algorithm has determined that the activity contained in the cluster is likely related to a specific action or series of actions by the trader. Clusters can vary in length from a fraction of a second to a few minutes long. Every action by a trader is contained in a cluster, and there is no limit to how many workflow events can be contained in a single cluster.
In order for machine learning to work, a rich set of data points is necessary to measure and compare the various features between the trader’s activity and the activity that is known to have caused prior regulatory attention. Clusters are rich with this measurable information, as they contain every order action in sequence by the trader for the length of the cluster.
The clusters may be thought of as “packets of intent” because each cluster contains a group of order actions (e.g., placing, modifying or cancelling orders) that are likely related due to the proximity of the trader’s workflow events. And because the cluster contains all the events for the entire clustered period rather than the select order events that would trigger a legacy alert, the full context of of the potentially abusive behavior is captured, analyzed and visualized to allow for a more thorough review.
Furthermore, because the clustering approach does not rely on arbitrary windows of time, the clustering method is effective regardless of the frequency of the workflow events. The clustering algorithm will dynamically change the time break required to end a cluster based on the time intervals between trades over time. This allows for effective clustering for both high-frequency trading (HFT) occurring milliseconds apart and manual trading.
Score Model Functionality
The training data, order transaction data and clusters all feed the models. Each model focuses on a particular category of disruptive or manipulative trading activity. For example, the Spoofing Similarity model focuses on simple spoofing behavior as well as other forms of spoofing, including layering, collapsing of layers, flipping and vacuuming. Other models focus on abusive messaging, momentum ignition, pinging, wash trading and more.
Similarity Scores
One of the biggest challenges that regulators and compliance staff face is determining where to focus their attention to ensure that they are achieving their mandate of effective supervision. Traditional parameter-based surveillance tools generate enormous amounts of unprioritized alerts where only a fraction might be considered true positives. Analysts need to sift through hundreds, if not thousands, of alerts, spending equal time on each until the handful of relevant results are eventually found.
The concept of a “similarity score” addresses this problem by scoring each alert based on the degree of mathematical similarity to past regulatory actions. This risk-based approach allows regulators and compliance staff to allocate their time and resources where they are needed most.
A similarity score is generated for each cluster on a scale of 0 to 100. A score of 100 indicates a very high degree of similarity to patterns that have drawn regulatory attention in the past, while a score of 0 indicates a very low degree of similarity. In this manner, TT Score provides specific guidance to users as to which clusters have the highest risk of drawing future regulatory attention and therefore are the most important for immediate review.
Data With Visuals Is More Effective
TT Score facilitates the prioritization and analysis of post-processed trading data via a unique user interface specifically designed to handle big data with regulatory compliance in mind. There are numerous unique visualizations that assist users in understanding where the risks are in their data, how the risks are distributed and how the risks are changing over time. This provides regulators and compliance staff with the ability to “see around corners” and take proactive steps to prevent disruptive or manipulative trading activity before it becomes a problem.
Tools such as Heatmap, Scorecard and Market Ladder Replay display instantaneous summaries of the vital statistics for each cluster and provide users with the ability to analyze each cluster in the context of the market conditions at the time the activity occurred. These research tools combine to provide regulators and compliance staff with the tools necessary to quantify a trader’s intent and understand the impact that the trader’s activity had on the market. This method provides users with a straightforward visual representation of how regulatory risk is being reduced within an organization, as opposed to simply looking at how many alerts are being cleared on a periodic basis.
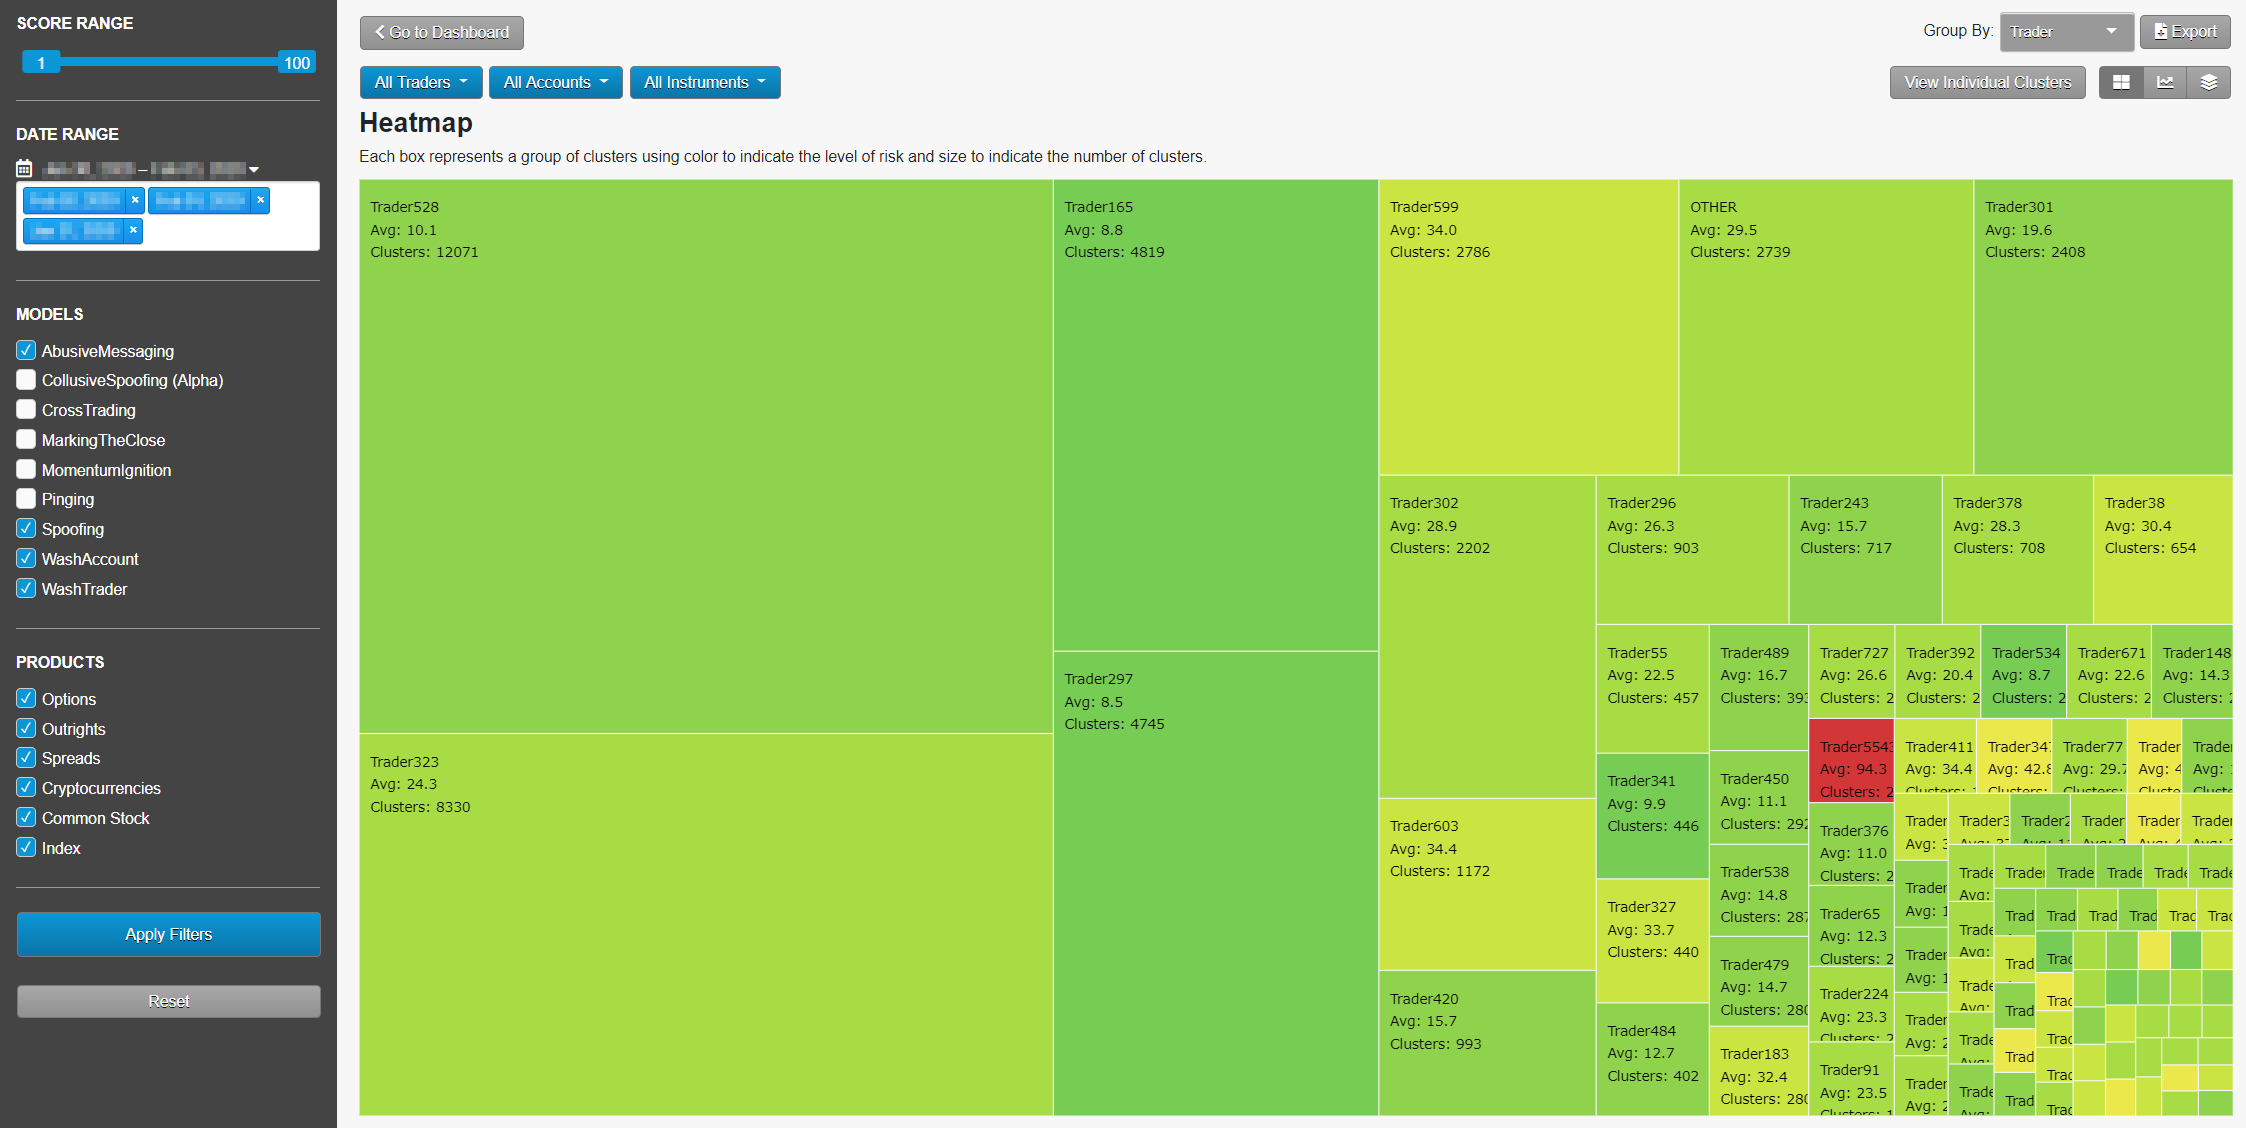
Focusing on Risk: Heatmap
The Heatmap display allows the user to see which traders or accounts are generating activity that has a high degree of similarity to regulatory cases. The bright red indicates high-risk clusters, and the size of each square indicates the number of clusters. In the following screen, we see that Trader88 is not generating the most clusters, but is generating clusters with a high average similarity score. With just a glance, Heatmap allows the user to efficiently allocate time and resources necessary to review the activity that generates the most risk.
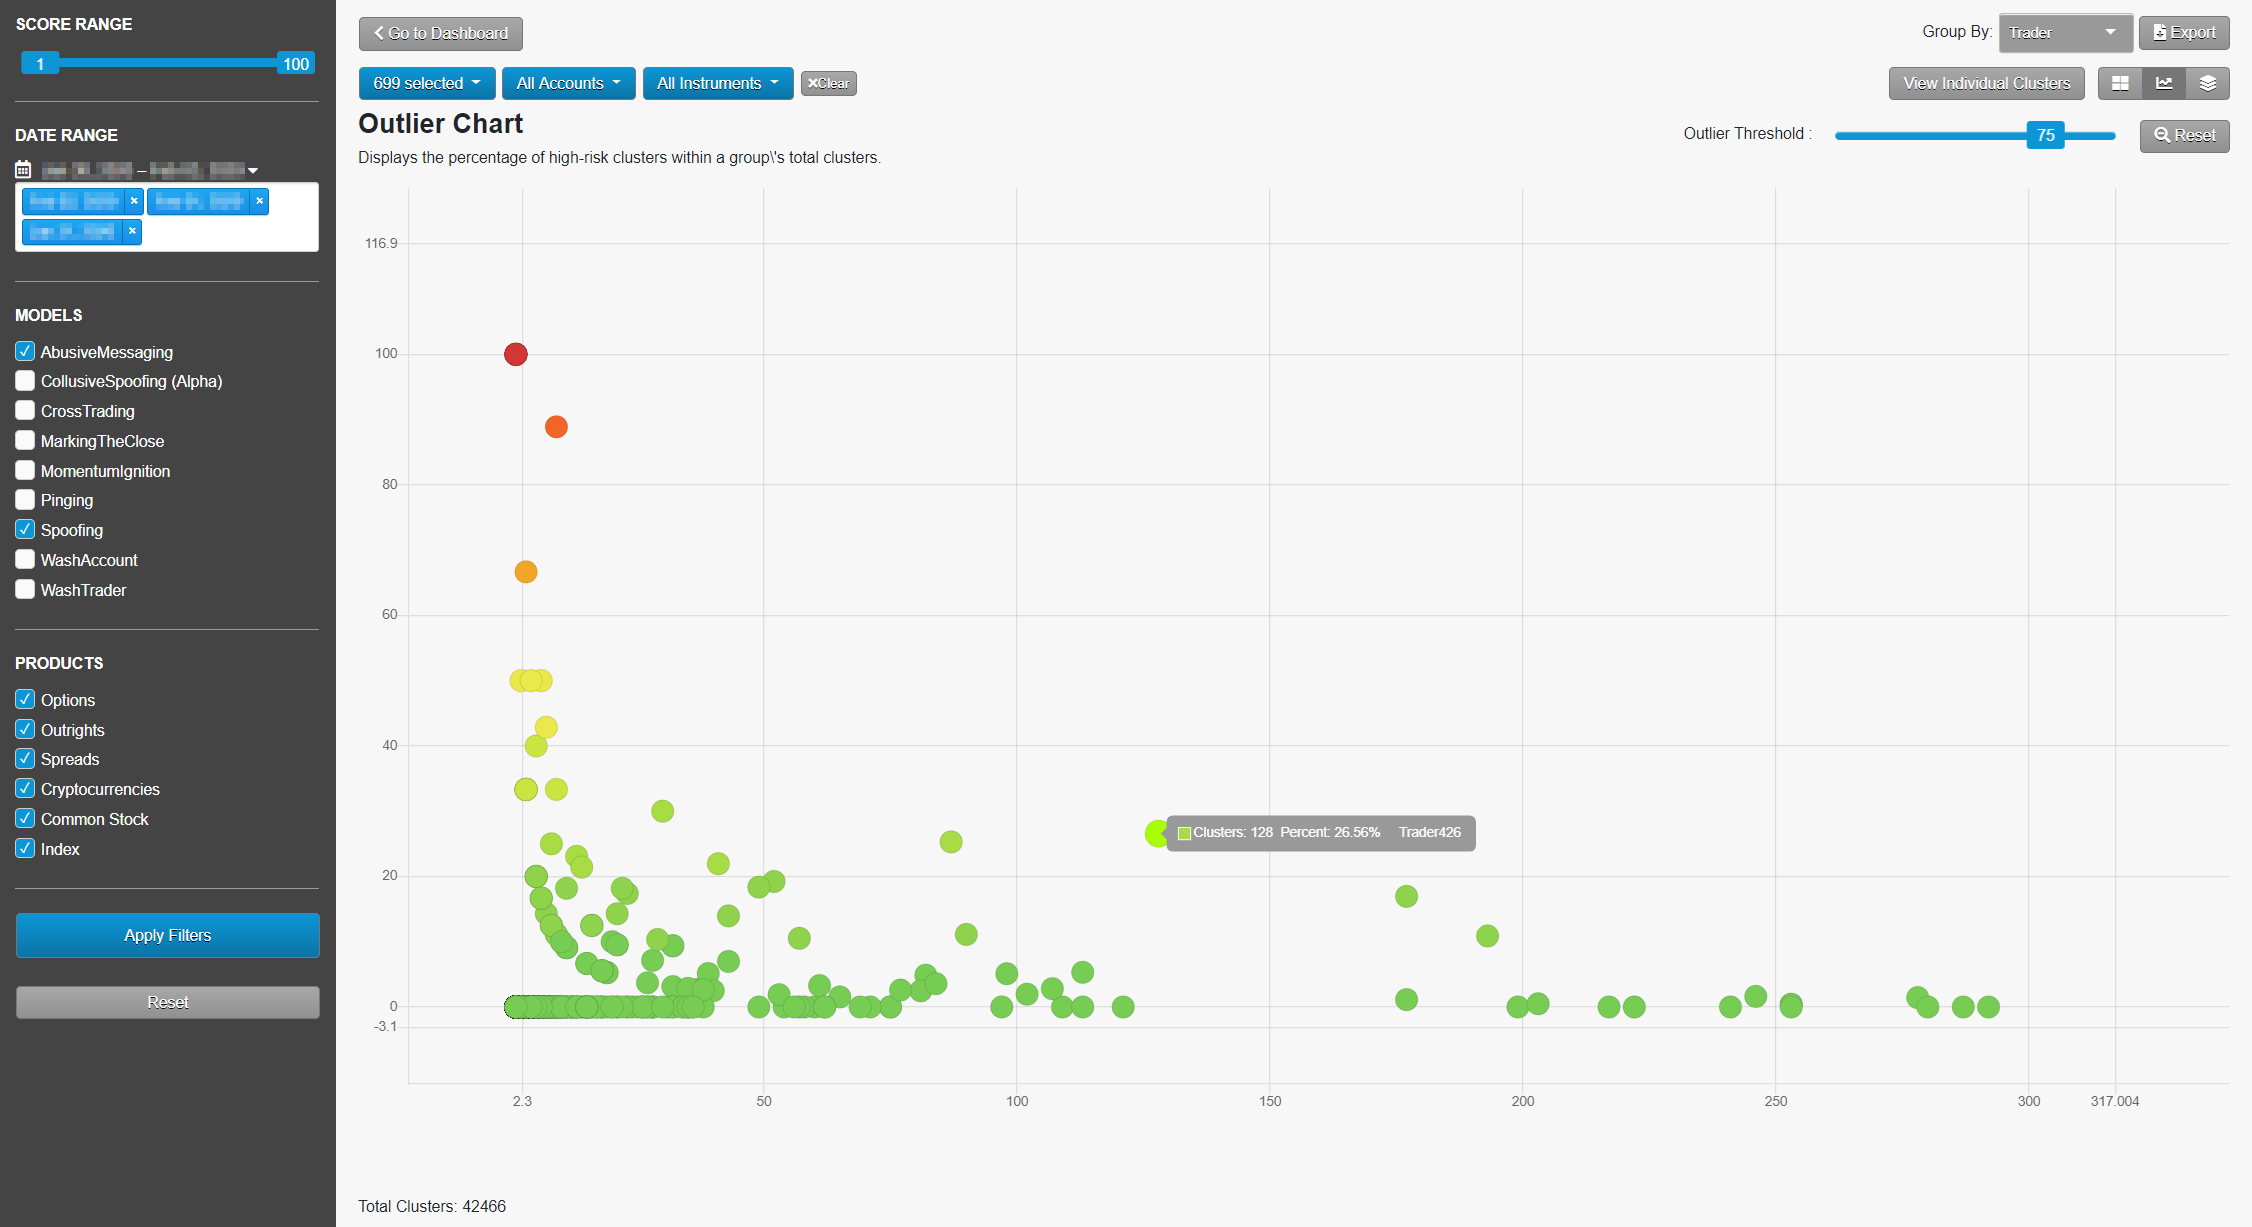
Visualizing Big Data: The Outlier Chart
The Outlier chart displays every entity’s percent of high-risk clusters compared to the total clusters on a single screen. This allows for easy detection of problematic trading in big data sets with disparate customer or trader cluster volumes. The user can review thousands of entities over multiple months in one visual and know that a low-volume trader with 10 clusters is not going to be lost among the accounts generating thousands or tens of thousands of clusters. What’s more, the user can set their own definition of what constitutes “high risk,” with the default high-risk score set at 80.
Investigating Trading Activity: The Scorecard
Scorecard provides a summary of the vital statistics of the cluster as well as an initial visualization of the pattern that was formed by the order and fill messages that comprised the cluster. The compliance officer can quickly view what happened for the given cluster of order transactions. The chart at the bottom of Scorecard provides a look at the volume of contracts traded within the cluster as well as how the order and trade activities unfolded over the relevant period of time.
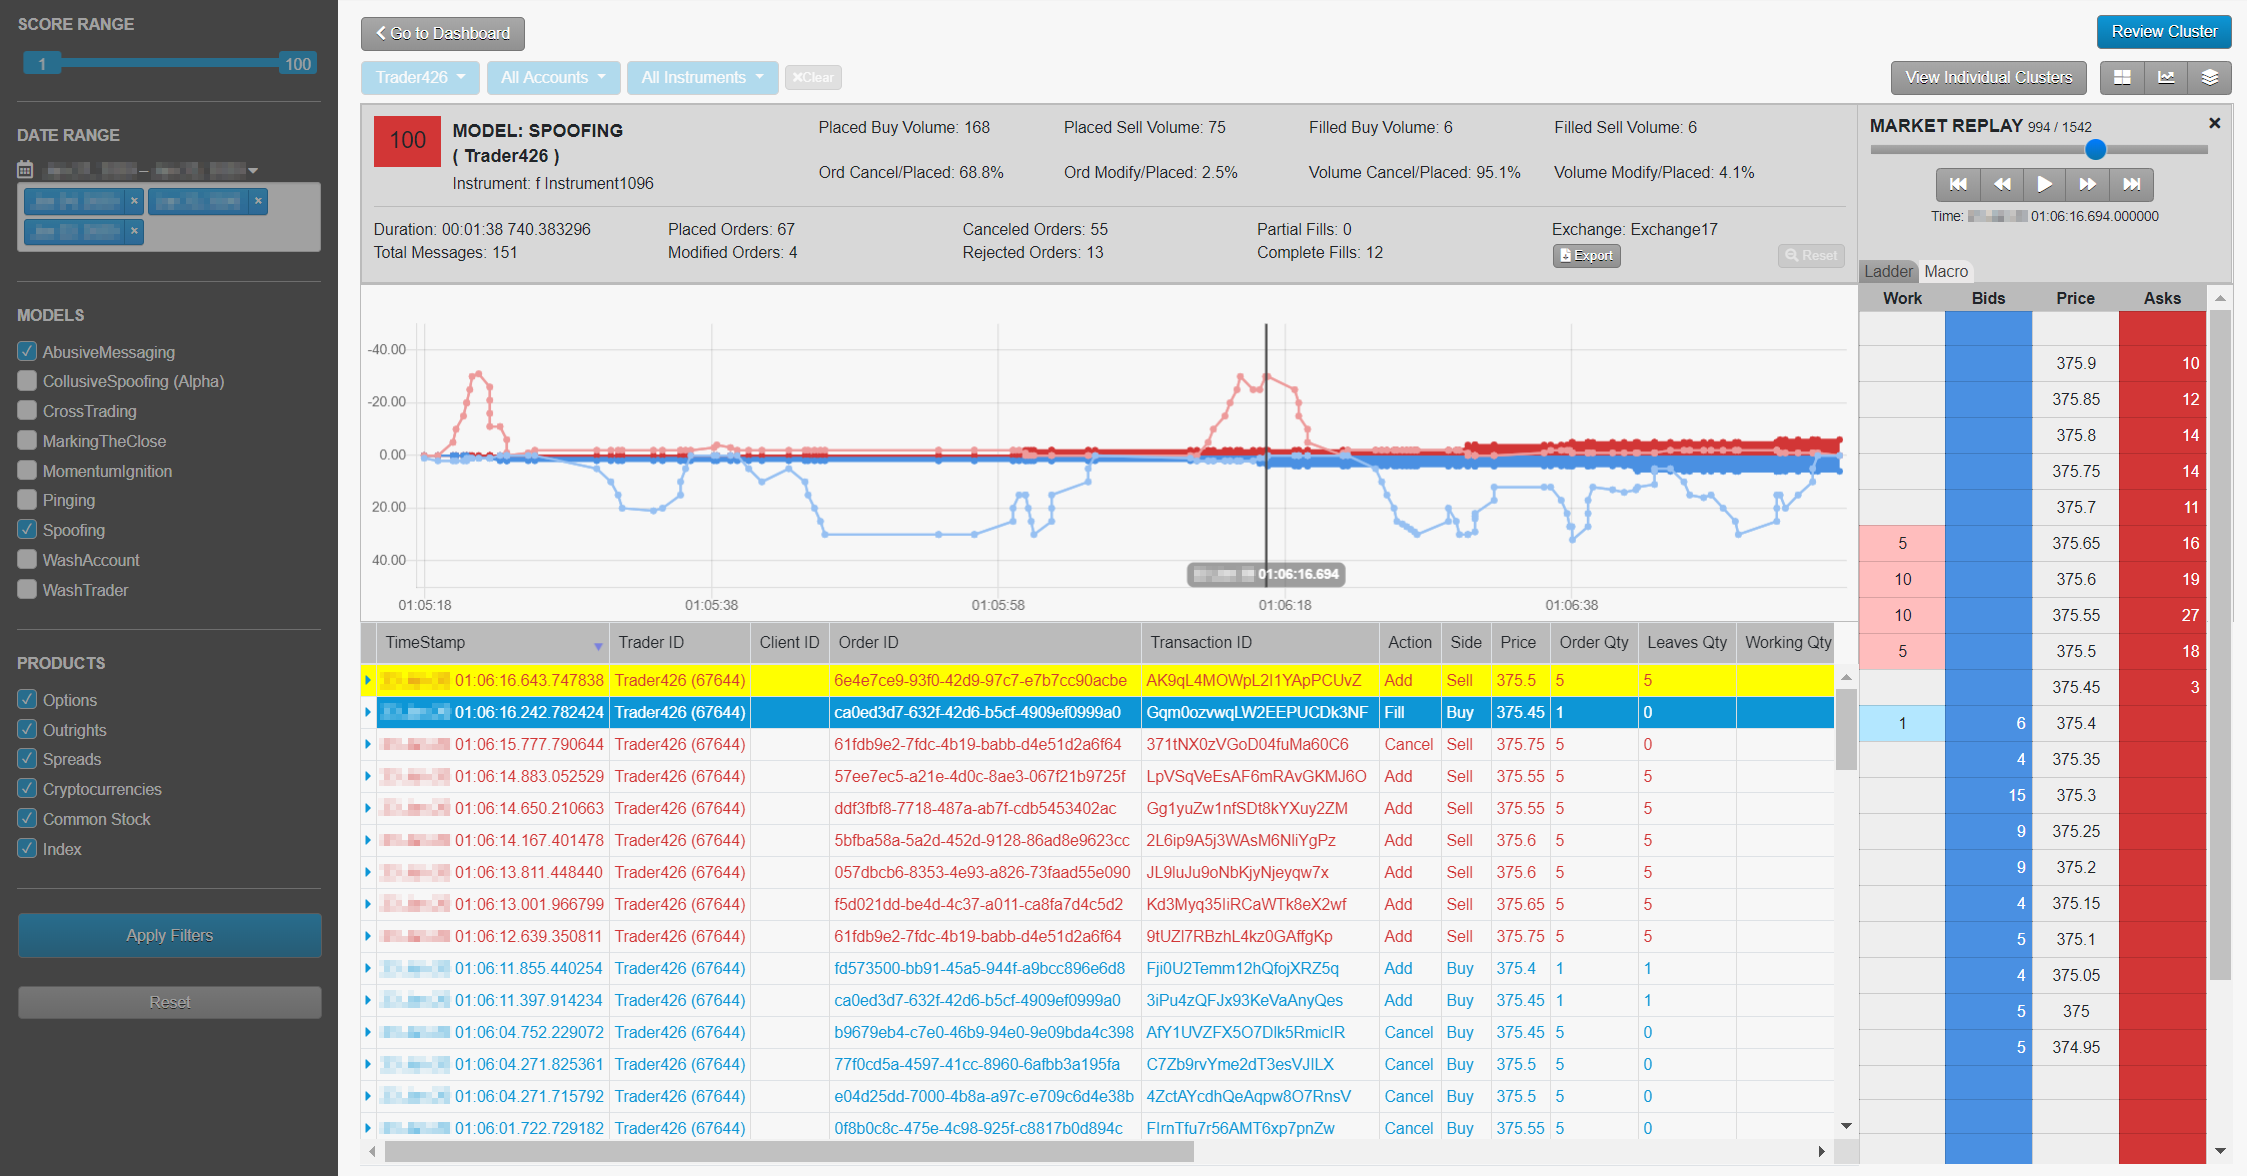
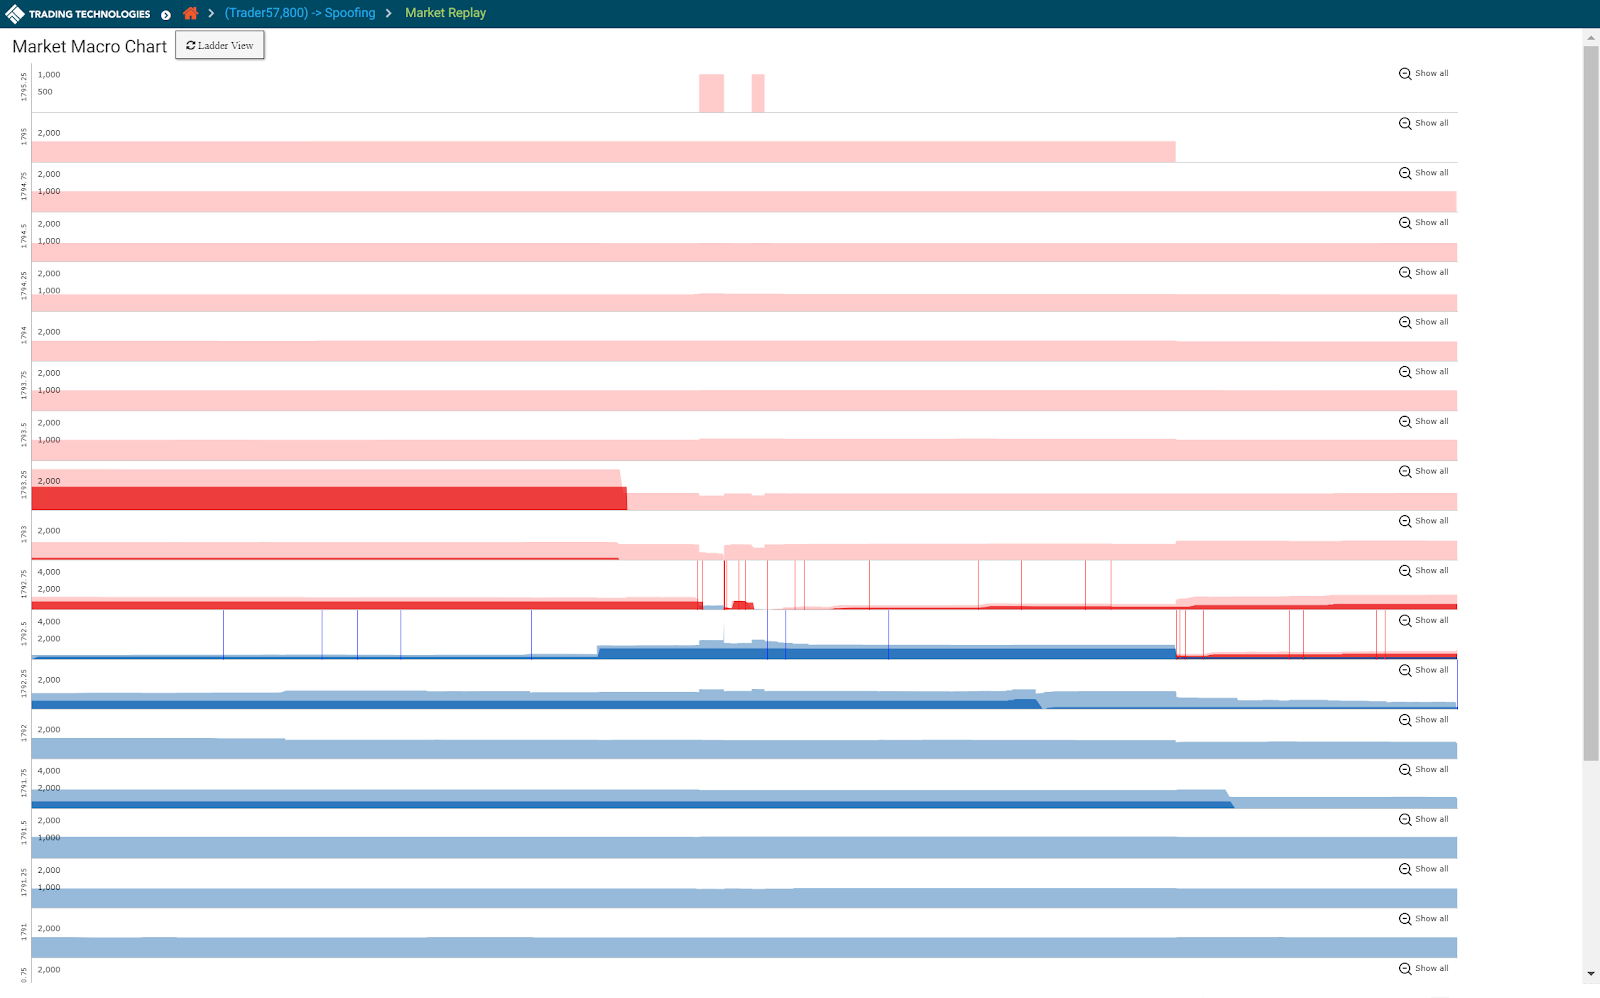
Replaying Market Data: Market Ladder Replay and the Macro Chart
Market Ladder Replay is a research tool that provides users with a frame-by-frame replay of the trading activity overlaid with Level 2 market data on a ladder-style interface. The ladder is 10 ticks deep and displays all market data, including the orders for each relevant participant in the order book. Users can stop, start and rewind the activity within a given cluster in order to gain a precise understanding of the sequence of events that occurred in the order book and how the trader’s orders impacted the market. Users also have the ability to slow down the activity in order to visualize orders submitted by HFT strategies that occur only milliseconds apart.
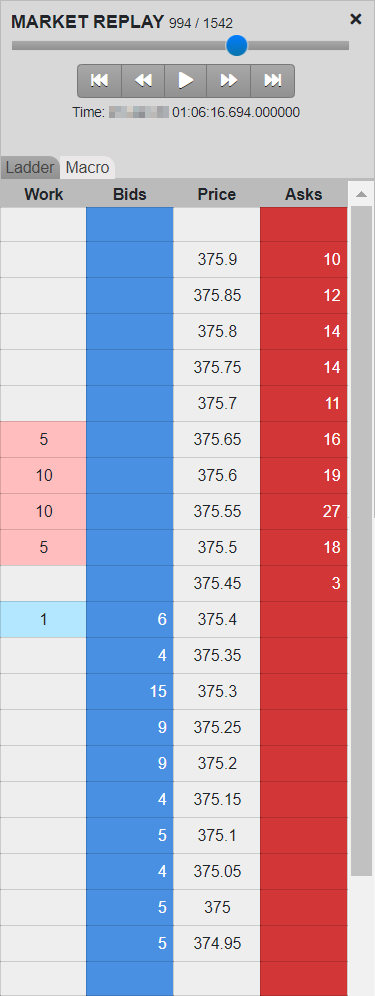
The Macro chart provides the same detail as Market Ladder Replay but visualizes both the Level 2 market and the trader’s data for the entire length of the cluster on a single screen. This single-screen view highlights the trader’s pattern of executions and working volume at various price levels over time compared to the rest of the market, allowing for a rapid assessment of the trader’s pattern of activity and any corresponding market reaction.