All posts by Trading Technologies

The March-June 2015 CBOT Treasury bond futures roll is generating a lot of buzz. Most people are used to trading the Treasury calendar spreads 1:1, and the current roll is trading 3:2. How is this possible? The 1:1 was so easy to calculate in your head, and now they say you have to trade it 3:2?

The five-year gap

Between early 2001 and early 2006, the U.S. Treasury did not issue any Treasury bonds. Nine years later, that gap comes into play because now there is a single issuance, stranded at the front-end of the delivery basket, that would have been eligible for delivery. In December 2013, CME Group announced that it would exclude the 5-⅜ percent of February 2031 U.S. Treasury bond from the contract grade for the delivery months June 2015, September 2015 and December 2015.

So what does that have to do with the 1:1 calendar spread? The removal of the single issuance makes June’s delivery basket, on average, five years longer in maturity than March’s. More importantly, the dollar value of a basis point (DV01) for the June contract is roughly 50 percent larger than that of March’s. In other words, for every two-tick move in the March contract, the June contract will move approximately three ticks. In order to compensate for that difference in value, one should only buy two June contracts for every three March contracts that he/she sells.

Price can be very misleading

In addition to the yield of a bond, the coupon rate and time to maturity are the biggest factors that determine price and hedge ratios. While yield relationships are relatively stable, the coupon and maturity can vary greatly from instrument to instrument. Even if the proper ratio for a bond spread was 1:1 (and that’s a big if because the ratio is not static and rarely even), the price difference is just a number. A decent sized move in both contracts could easily result in the same yield spread we started with, but a wildly different price spread. When dealing with weighted spreads like the 3:2 March-June bond spread, keeping track of the weighted price differential while trying to stay properly hedged can be an arduous task. (Note the current ratio of the March-June spread is actually 305:200 at present, making this even more difficult.)

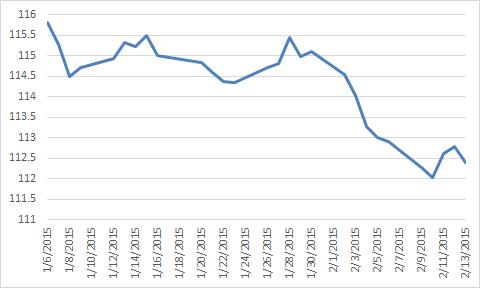
In just the last six weeks, the “properly” weighted March-June bond spread has had a price differential with a range of 3-½ bond points or 112 ticks.


Continue Reading →

If you follow us on Twitter, LinkedIn or Google+ or if you get our newsletter, you probably already know that we’ve begun to preview some of the noteworthy functionality that will be available in the next-generation platform, which we are calling, simply, TT. You can easily find this content on Twitter and Google+ by searching for the hashtag #PreviewTT.

Last week, we showed how easy it is to get started with the new platform. The software-as-a-service (SaaS) delivery model makes it possible for firms to onboard new users in a matter of minutes from virtually any internet-connected computer, and the process is just as simple from the user’s perspective. Since the new platform doesn’t require a software install, a user with an established FCM account can typically begin trading on TT immediately after accepting an online invitation.

This is exciting news for our customers, some of whom are now starting to experience these benefits firsthand as we accelerate rollout to early-stage users.

Below you can see the content we shared last week on Twitter. This week, we’ll be spotlighting the unique aspects of workspace creation and access.

Continue Reading →

Figure 1: TT Analytics in ADL.

With the release of X_TRADER® 7.17.40, TT introduced a new feature in ADL® named TT Analytics. This feature uses a single block that brings a historical data solution to ADL along with a suite of technical indicators. It provides almost every value found in an X_STUDY® chart to your server-side algo. In this blog post, I will introduce the block while demonstrating how to find some important trading reference points.

The TT Analytics Block can be found under Misc. Blocks on the left side of the ADL Designer Window. You simply drag this block onto the canvas and double click it to expose the properties page. If you’re an X_STUDY user, the properties page will look familiar to you. Here you can add technical indicators and expose bar values such as open, high, low and close.

Figure 1 above shows the block with open, high, low, close and VWAP for the current daily bar of the December ES market. It also shows the Bollinger Bands technical indicator added to the block.

Next, you add an Instrument block to the TT Analytics Block from within the properties page and define the type of bar data you want returned. Once this is complete, you can go in either of two different directions: you can add a technical indicator to the block or expose more bar data.

Continue Reading →


This is the second half of a two-part blog post based on my interview with FOW magazine regarding the growing adoption of cloud computing within finance and trading. If you read part one already, thanks for coming back. If you missed it, you can read it here.

FOW: What prompted the decision to move the platform on to a cloud-provision basis?

MM: We made the decision to leverage the cloud because of the many benefits it will provide to our users. One of the biggest benefits of cloud services is accessibility. Users can access the TT platform over the Internet through a browser, desktop or mobile device.

Distributing software via a cloud-provisioned platform also provides users with significant secondary benefits. In a SaaS model, the provider has direct control over the user experience. In our next-generation platform, for example, we are able to tune our application and infrastructure for the highest performance because we operate the solution end-to-end and across technology stacks.

Additionally, SaaS is more operationally efficient from the perspective of the service provider. SaaS allows for uniform service deployment and operation and direct visibility into the state of services. We directly monitor the application and infrastructure 24×7, which gives us deep visibility into system performance and helps us anticipate and prevent impending problems. When there are issues, we can roll out fixes to our global user base in a matter of minutes. This level of manageability and support is difficult, if not impossible, to achieve for an ISV supporting many bespoke on-premise deployments.
Continue Reading →

Recently I was interviewed by FOW magazine about the growing adoption of cloud computing in finance and trading. As we are both a provider and consumer of cloud services, we have an interesting, credible perspective. 

Our next-generation trading platform, which we are simply calling TT, is delivered via software-as-a-service (SaaS) and underpinned in part by third-party cloud services. FOW’s questions were provocative and on point given the many conversations I and others at TT have held with our customers in preparation for launching our next-gen platform. I thought it was worth recapping the interview in a two-part post for our blog readers.

Part one is below. Look for part two here next week.

FOW: What demands are you seeing from clients that reflect the current trends/state of play in the market?

MM: Our customers continue to put downward pressure on trading technology costs while demanding expansion into new markets; these seem to be perpetual trends. Outsourcing of the trading infrastructure is now a more attractive option due to the lower cost of a shared solution and the reach of networks into global markets. Moreover, a larger pool of firms now sees outsourcing as an attractive option due to the ubiquity of low-latency performance, improved understanding of security in the cloud and increased reliability of cloud solutions.

Continue Reading →