I recently ran across an interesting post on EliteTrader. The author was looking for software capable of charting synthetic spreads with more than two legs such as the bund-bobl-schatz fly or crack spread. I shared my thoughts on the topic in the EliteTrader forum, but I thought the topic was compelling enough to address here on Trade Talk.
As was mentioned on EliteTrader by another member, charting a synthetic spread created from the underlying legs is not as simple as comparing the last traded price of one leg to the others or using one-minute bar data to compute the spread prices. To prevent from “charting a mirage” as the member stated in the post, we have gone out of our way to provide a better spread chart here at TT. We capture all best bid-ask market moves and traded prices, such that we look at one leg’s best bid or ask price when a trade occurs on the other leg’s bid or ask.
The above method creates an excellent synthetic spread chart, and we support up to 10 legs in a spread. The nice thing about TT is once you create the spread for trading, there is no additional work to create the spread chart. You can request the synthetic instrument and add studies and drawing tools just like a regular instrument in the chart.
Our bid-to-bid/ask-to-ask spread charts will calculate a spread price whenever there is a trade on one leg. If the trade occurs on the bid of leg one, then we will look at the bid of the other legs if they are required to sell and the ask if they are required to buy to determine the spread price. This effectively acts as getting edge on one leg with a limit fill, and the other legs going to market to complete the spread.
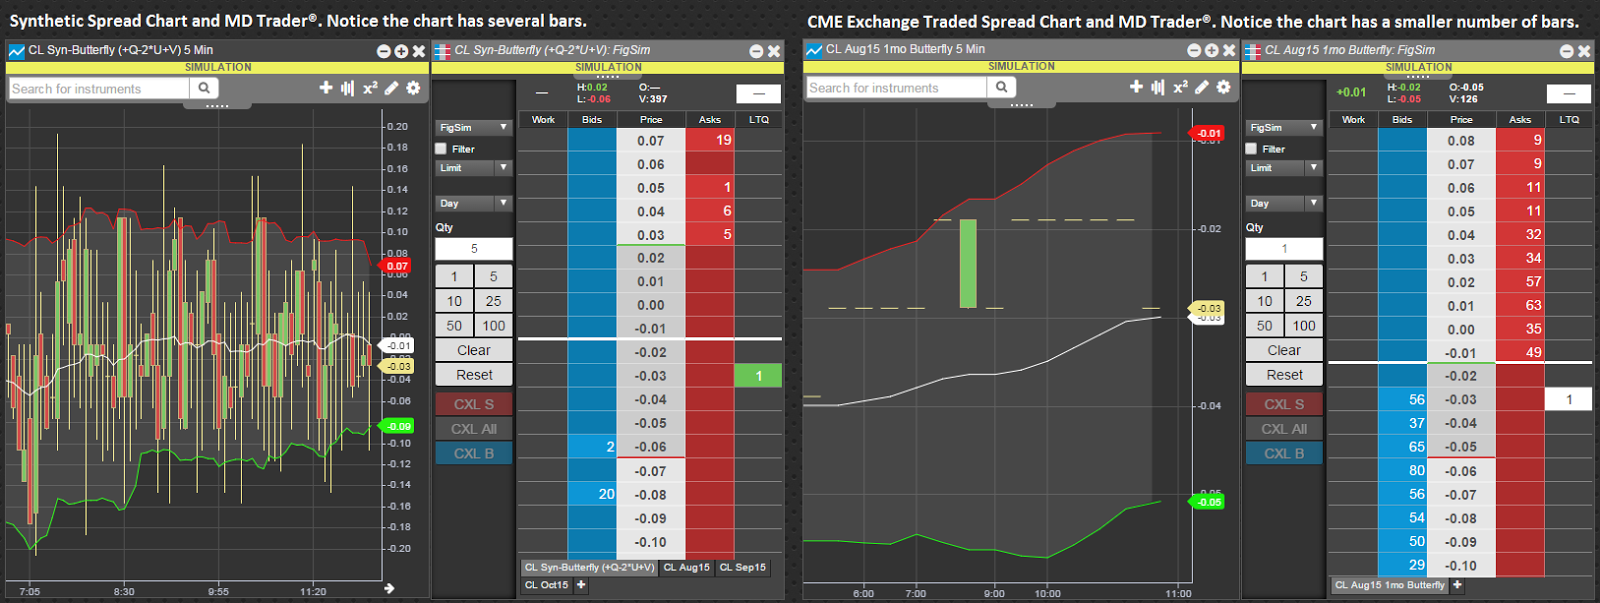 |
| Synthetic spread charts (L) will have more data and provide more information about how a spread moves compared to exchange traded spread charts (R). |
The image above contains two screenshots that illustrate the difference between using synthetic spread charts (L) and exchange traded spread charts (R). One thing that stands out is as long as there is one leg in the spread that has liquidity, the synthetic chart will have more data will provide the trader with more information as to how the spread moves. (Some exchange traded spreads have so little liquidity that a move can occur, but if no trade occurs, the movement is not displayed in a chart of the exchange traded spread.)
Below is a screenshot of a comparison chart between an exchange traded spread and a synthetic spread. We are currently working on adding comparison charts in the next-gen TT platform over the next two months.
 |
| Comparison chart of an exchange traded spread and a synthetic spread. |
Soon we will take spread charts even further by allowing for additional spread chart options like charting mid-to-mid prices of the spread. I’ll write more about that here on Trade Talk when the time comes.