Thursday 12 September 2024
Andaz London Liverpool Street

TT® Score: The Perfect Marriage of Augmented Analytics and Big Data Visualizations
“Some people call this artificial intelligence, but the reality is this technology will enhance us. So instead of artificial intelligence, I think we’ll augment our intelligence.”
Ginni Rometty, former CEO of IBM
This quote from Ginni Rometty perfectly captures what we have been aiming to accomplish with TT Score since we started working on it several years ago. We are not applying machine-learning technology to trade surveillance in order to automate compliance officers out of their jobs.
In fact, our goal is the exact opposite—what we are doing is using modern technology to create the most powerful trade surveillance system in the history of the financial industry in order to make compliance officers better at their jobs, and therefore improve the quality of their lives.
And this brings me to the purpose of this blog post, which is to announce the release of one of the most exciting and powerful features to be added to TT Score since its inception: the Risk Trend Report.
At first glance, the name of this new feature may seem rather boring. “What is the big deal about releasing a new compliance report?” you may be asking.
That is a fair question, but allow me to respond by explaining that this is in fact a groundbreaking new feature that marries augmented analytics with big data visualization tools to deliver massive workflow efficiencies and clear insights into regulatory risk for compliance professionals that have never been offered by a trade surveillance system in the history of the financial industry.
I realize that this is a bold statement, and for you compliance professionals out there who prefer to “trust, but verify,” allow me to provide the following additional facts to back up this statement.
Augmenting Human Experts by Eliminating Human Bias in Parameter-Tuning and Applying a Risk Score for Workflow Efficiency
Traditional surveillance tools, often developed in-house or available through various third-party vendors, are almost exclusively parameter- or rule-based. They function by applying if-then logic overlaid with configurable thresholds over arbitrary windows of time. In theory, the ability to configure these parameters lets users customize the alert output to their business needs; however, in practice, such configurations are often set to fit the capacity of the department reviewing the alerts, not on the validity of the results. This approach also poses serious risk for compliance staff because if the parameters are too loose, then the reports are inundated with false positives, and if the parameters are too tight, there is a risk of missing abusive conduct altogether.
Unlike these legacy systems that require their users to set (and constantly tune) parameters, we train our machine-learning powered Spoofing model with data from real regulatory cases. These data sets contain patterns of trading activity that we know have drawn regulatory attention in the past. By taking this machine-learning based approach, we are removing the human bias that is inherent in the parameter-setting process, and instead allowing our users to see through the “eyes of the regulator” by mathematically measuring the patterns within their own trading activity against the patterns of trading activity from the regulatory case data that we know have drawn regulatory attention in the past.
In addition to offering these unparalleled detection capabilities that do not require parameter-tuning, the machine-learning Spoofing model also augments the human compliance expert by providing a “risk score” for all alerts.
Historically speaking, traditional parameter-based surveillance tools are notorious for generating enormous amounts of unprioritized alerts where only a fraction might be considered true positives. Analysts therefore need to sift through hundreds, if not thousands, of alerts, spending equal time on each until the handful of relevant results is eventually found. The concept of TT Score’s risk score addresses this problem by scoring each alert based on the degree of mathematical similarity to past regulatory actions. This risk-based approach allows regulators and compliance staff to allocate their time and resources where they are needed most.
A risk score is generated for each cluster on a scale of 0 to 100. A score of 100 indicates a very high degree of similarity to patterns that have drawn regulatory attention in the past, while a score of 0 indicates a very low degree of similarity. In this manner, TT Score provides specific guidance to users as to which clusters have the highest risk of drawing future regulatory attention and therefore are the most important for immediate review.
The Risk Score and the Risk Trend Report Can Together Tell the Data Story for the Compliance Officer
TT Score now takes the concept of the risk score to the next level, by marrying it with our new Risk Trend Report. The Risk Trend Report allows users to generate easy-to-understand line charts that can be used to quickly identify trends and patterns within big data sets, over large time periods. It is similar to having a data scientist on staff, but you don’t have to worry about them leaving for Google or Amazon for a better job offer (that was a joke).
The following are a couple of hypothetical but life-like scenarios that illustrate how compliance staff can leverage the Risk Trend Report to improve their compliance processes.
Scenario 1 – Trends
In the screenshot below, we see a Risk Trend Report for the ExchangeMessagingRateLimit model for the month of April:
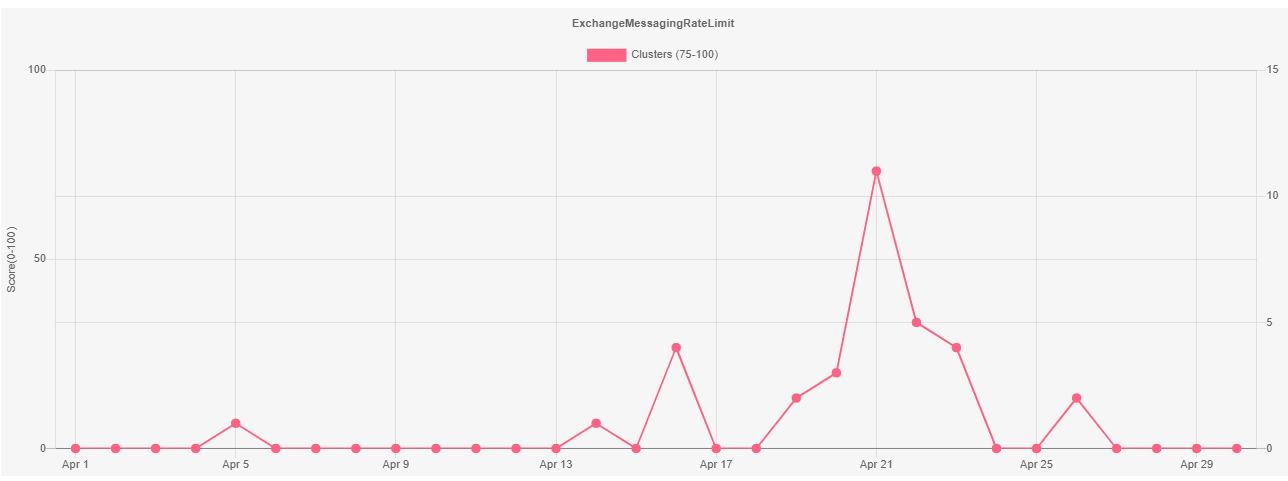
What can be learned from the above screenshot?
- On April 5, there was a slight increase in clusters that were scored between 75-100 by the model. All of TT Score’s models have been designed so that clusters in the 75-100 range are deemed to be “high-risk,” and we therefore recommend that compliance users focus on clusters in this scoring range during their compliance reviews.
- We see that there were two more increases in the number of clusters between 75-100 on April 14 and 16.
- We see a very large increase in the high-risk clusters on April 21.
In this scenario, the compliance staff could have utilized the Risk Trend Report to recognize the trend of increasing high-risk clusters on April 14 and April 16, and taken a proactive approach to compliance by discussing with the traders why the scores were increasing before the very large spike in high-risk clusters occurred on April 21 (which by that time had a very high probability of drawing regulatory attention).
It is also noteworthy that the Risk Trend Report provides compliance users with a straightforward visual representation of how regulatory risk is being reduced within their organization, as opposed to simply looking at how many alerts are being cleared on a periodic basis.
Looking again at the screenshot above, the chart shows that after April 21, there was a decrease in the number of high-risk scoring clusters being generated by that model. Compliance staff can choose to provide this chart to the firm’s management as evidence that TT Score is being used effectively to mitigate regulatory risk within the organization. FInally, the chart could also be provided in response to a regulatory inquiry as evidence that the compliance staff is supervising its trading activity, and has already taken steps to resolve the issue (which is typically the best way to make a regulator lose interest in pursuing the matter further).
Scenario 2 – Patterns
In the screenshot below, we see a Risk Trend Report for Marking the Close for the month of March:
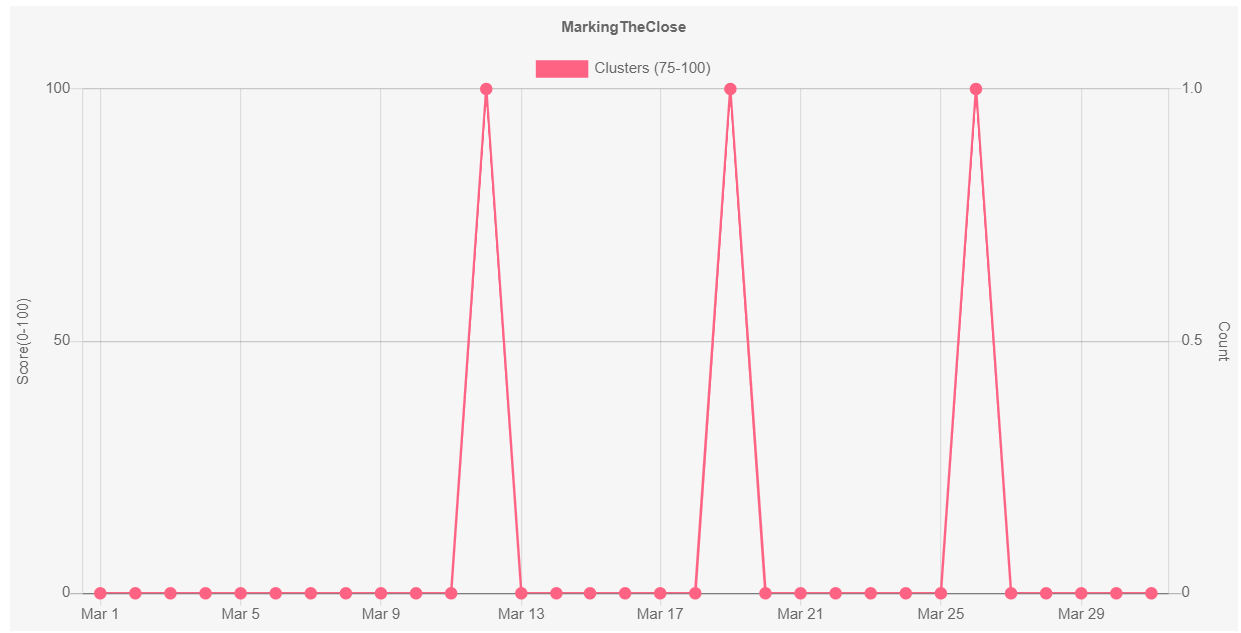
What can be learned from the above screenshot?
- In this chart, we see that a particular trader had three instances where the Marking the Close model scored one of the trader’s clusters in the 75-100 range on March 12, March 19, and March 26.
- When looking at these clusters individually, they may at first glance appear to be “one-offs” as the model has only scored three of the trader’s clusters as high-risk for the entire month.
- However, what becomes clear by looking closely at the Risk Trend Chart in this scenario is that a pattern has formed where each of the high-risk clusters occurs on a Friday.
- If the compliance user utilizes the Risk Trend Report to successfully identify this pattern, they can then load the trader’s data on TT Score and investigate these clusters more closely to determine if the trader may have been attempting to manipulate the price of the products in question at the end of each week.
- And finally, if the compliance user does believe there is adequate evidence that manipulation may have occurred based upon the pattern as well as the activity within the clusters, then a conversation with the trader would be warranted, and the compliance user can document all of the steps taken and any conclusions made in the TT Score case management system.
These two scenarios are just scratching the surface of ways that the Risk Trend Report can help compliance staff. TT Score users can specify any date range they desire and immediately view the results for their entire company grouped by model, trader, account or instrument.