Geographical Arbitrage
Have you ever wanted to buy something in one location to sell it in another location at a higher price? Imagine buying gold on CME only to turn around and sell it on TOCOM at a higher price. This type of trade is known as geographical arbitrage.
While there is risk in every trade, geographical arbitrage is relatively low risk. The faster you can execute and the more alike the underlying products, the better the arb. Gold as an underlying makes for an almost perfect hedge, as the gold quality is identical. This is not true for most other commodities.
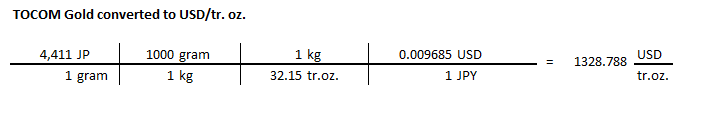
One major factor here is the two products are priced in different currencies. A currency conversion is required, and this conversion value is not static like some other conversion factors used for spreading. For example, in this spread, I will use a static conversion of 1 kilogram equal to approximately 32.15 troy ounces. This value will not change during my arb, but the dollar-to-yen ratio will.
Let’s begin by calculating how to set up this trade. I will convert the yen-to-dollar using 6J on CME and grams to troy ounces. Below is a table that shows this conversion to get TOCOM gold priced in U.S. dollars and troy ounces.
This trade has always been possible with X_TRADER®, but until the release of X_TRADER 7.17.0, which introduced custom spread formulas in Autospreader®, incorporating the dynamic currency conversion was not possible. You would have to assign a static conversion value.
As you can see in the Autospreader configuration below, I have selected a custom formula and added the three legs of this spread. For CME gold and 6J contracts, I adjusted the multipliers to place the decimal in the correct location.
 |
| Custom spread formulas in Autospreader® are now available with the release of X_TRADER® 7.17.0. |
You will notice I used different months on the TOCOM gold and CME gold contracts. Why? Well if you examine which contracts have volume on the two exchanges, you will notice that CME volume is heavy in the front months. TOCOM gold is the opposite, with heavier volume in the back months. I’ve selected the months based on this observation in the market window below.
 |
| Comparing TOCOM gold and CME gold volume. |
Now to show you the chart for this custom spread. This is my real purpose of today’s blog post. I wanted to show that with the release of X_TRADER 7.17.20, we enhanced X_STUDY® to version 7.9.20, which can chart these custom spread formulas. The screenshot below shows an X_STUDY chart and MD Trader® ladder for the above spread. I’ve added a Keltner Channel study to the chart and linked the values directly into MD Trader as laser lines.
 |
| With the release of X_TRADER® 7.17.20, X_STUDY® now charts custom spread formulas. |
Next time, I will demonstrate one of the other powerful features found in X_STUDY 7.9.20. Until then, if you’re an X_TRADER user, I hope you enjoy this new feature. And if you’re not, give X_TRADER a test drive today.