← Back to Trade Talk Blog
We’re excited to announce our one-stop online destination for all training materials related to the TT platform. The new training site contains training videos and materials targeted to both traders and administrators, with even more topics in development. The site also allows users with a TT login to save training materials under the My Tutorials section for later viewing.
Last week on Twitter, #TTtraining highlighted new training material for the TT platform analytics and charting functionality.
The TT Charts and Time and Sales widgets provide users with a variety of robust tools to assess the market and make informed trading decisions. For example, traders can:
- Quickly and easily view the high, low, open and close for any product using TT Charts.
- Leverage over 80 technical indicators to analyze market activity.
- Identify market trends with moving averages.
- Easily view trade data with the Time and Sales widget.
And just like the trading application, the analytics and charting apps are accessible via Android and iOS mobile devices through TT Mobile.
Continue Reading →
Tags: Charting, Trade Execution
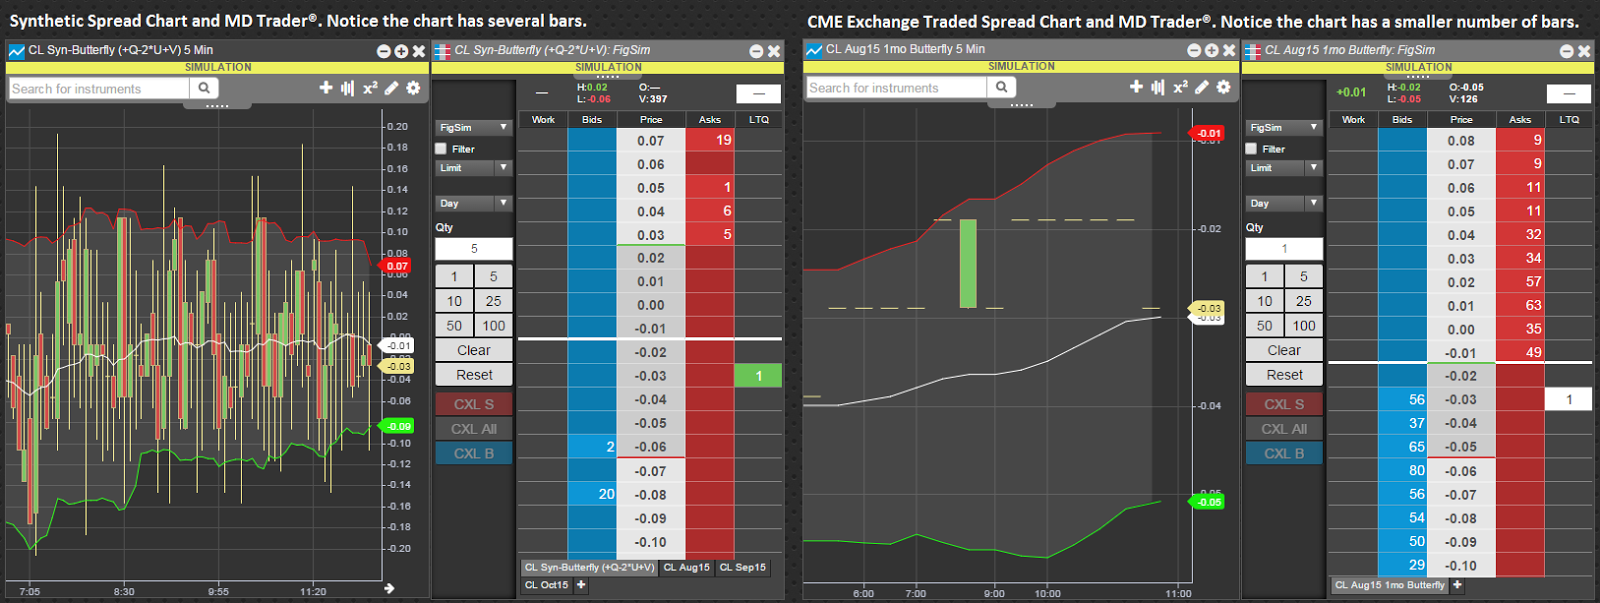
I recently ran across an interesting post on EliteTrader. The author was looking for software capable of charting synthetic spreads with more than two legs such as the bund-bobl-schatz fly or crack spread. I shared my thoughts on the topic in the EliteTrader forum, but I thought the topic was compelling enough to address here on Trade Talk.
As was mentioned on EliteTrader by another member, charting a synthetic spread created from the underlying legs is not as simple as comparing the last traded price of one leg to the others or using one-minute bar data to compute the spread prices. To prevent from “charting a mirage” as the member stated in the post, we have gone out of our way to provide a better spread chart here at TT. We capture all best bid-ask market moves and traded prices, such that we look at one leg’s best bid or ask price when a trade occurs on the other leg’s bid or ask.
The above method creates an excellent synthetic spread chart, and we support up to 10 legs in a spread. The nice thing about TT is once you create the spread for trading, there is no additional work to create the spread chart. You can request the synthetic instrument and add studies and drawing tools just like a regular instrument in the chart.
Our bid-to-bid/ask-to-ask spread charts will calculate a spread price whenever there is a trade on one leg. If the trade occurs on the bid of leg one, then we will look at the bid of the other legs if they are required to sell and the ask if they are required to buy to determine the spread price. This effectively acts as getting edge on one leg with a limit fill, and the other legs going to market to complete the spread.
 |
Synthetic spread charts (L) will have more data and provide more information
about how a spread moves compared to exchange traded spread charts (R). |
Continue Reading →
Tags: Algos & Spread Trading, Charting, Trade Execution
Today’s financial markets generate a volume of data barely dreamed about in the early days of electronic trading. Every year, exchanges create a record-breaking amount of transactions, and we know that somewhere within all of that data there lies a digital treasure chest. Finding a way to analyze and deliver this valuable data is a multi-headed problem, roughly broken down between charting, historical trade display and research scenarios.
In my role as an engineering manager at TT, I’m part of a team that’s been working to solve this problem in the new TT platform. We think we’ve found the answer by leveraging cutting-edge technologies, Node.js and Amazon Web Services (AWS). I’m excited about our solution, which is now automatically available to all TT platform users. Read on to learn more about our approach and how it can help you overcome the multi-faceted big-data challenges we all encounter today.
Node.js
Node.js is a run-time environment built on the same technologies that power the web, namely JavaScript. It was built around a few simple ideas and has rapidly grown out of its San Francisco hacker origins into enterprise software used by huge firms like Walmart and PayPal. If you have ever worked at a large enterprise with existing legacy architecture(s), you probably know how hard it is to turn an organization of that size onto a brand-new, relatively unknown technology platform. The answer in the case of Node.js is, surprisingly, very simple. Node.js is arguably the best web service platform available today, even though it hasn’t even hit the 1.0 version mark yet. Coding is simple, performance can be faster than Java/C++ web server(s) and the platform is easily scalable with features like the Node.js Cluster API.
One of the new technologies that makes the TT platform possible is WebSockets, which we use to deliver real-time data to both our mobile and desktop users around the world. Writing a WebSocket server with Node.js is as simple as writing just a few lines of code. Check out this example from the popular Node.js “ws” package. This is literally all you need to run a WebSocket server in Node.js:
 Continue Reading →
Tags: Charting, Trade Execution
Last week on Twitter, we showed how the new TT platform takes charting and analytics to new levels, with sophisticated tools for the high-performance professional trader.
TT allows you to create and access charts from virtually any computer as well as Android and iOS phones with support for a vast array of chart types, technical indicators and built-in drawing tools. You can add a chart to any workspace and customize it to your preferences to chart outrights and spreads from any TT-connected exchange. Charts are saved as part of your go-anywhere TT workspace so that when you go from the office to home or from one day to the next, you can quickly pick up where you left off.
Continue Reading →
Tags: Charting, Trade Execution
Last week on Twitter, we showcased our new TT Mobile application. This high-performance, on-the-go trading app will allow users of the next-generation TT platform to view and trade the markets from any Android or iOS phone.
The response has been tremendous, but I don’t think any of us at TT are surprised.
Unlike most mobile trading apps, TT Mobile was built from the ground up for the professional trader. It extends the robust functionality of the TT desktop application to a mobile device in a form factor uniquely designed for the phone. Everything—including MD Trader®, charting and the “forever” Audit Trail—is optimized to provide both ease of use and security. You can monitor markets, check positions, enter or modify orders, trade out or practice trading in simulation from pretty much any location.
And TT Mobile sits on the same network infrastructure as the desktop application, which means all orders route through the same high-performance co-location facilities to deliver low-latency execution.
Continue Reading →
Tags: Charting, Trade Execution